- Home
- Microsoft Office
- Advanced Excel Skills: The Ultimate Guide to Mastering Microsoft Excel
Advanced Excel Skills: The Ultimate Guide to Mastering Microsoft Excel
Microsoft Excel is a handy tool for all forms of business in recent days. It has a pool of benefits that always comes in handy for every organisation. Thus, new and existing professionals need to learn advanced excel skills, irrespective of the professional field.
Therefore, this article would give you a broad overview of Microsoft Excel and all the advanced Excel skills you need to know and make you chuffed to bits. Learning these skills would make you more valuable in your profession and handy when applying for new jobs and going for interviews.
What is Microsoft Excel?
Microsoft Excel is a type of software program, introduced by the Microsoft company. It is compatible with all kinds of devices distributed by either macOS or Microsoft Windows. This program is in the form of a spreadsheet. You can analyse, formulate or add different data types and add formulas to other cells in the spreadsheet.
Other features include- inserting pivot tables, graphs, creating macros, histograms, line graphs etc. We will soon get into the depth of its features and uses. You would be able to purchase this software through Office 365 powered by Microsoft. Microsoft Excel allows you to arrange all types of data and later analyse the trends.

The programming language used for MS Excel is called Microsoft Visual Basic. It allows users to create numerous complex numerical methods. In addition, programmers can code straightforwardly utilising the Visual Basic Editor, including Windows, for composing code, troubleshooting, and code module association.
Microsoft Excel: Then and Now
During the early days, people only used MS Excel for basic bookkeeping and record-keeping for organisations. One of the most favourite features of all organisations was the “Autosum” option of MS Excel because they had to spend less time counting manually. This option saved a lot of time for bookkeepers and accountants.
In addition, they found it quite handy in preparing payrolls, financial statements and tax returns. This tells us that MS Excel has always played a key role in assisting owners and employees in company operations.

In contrast, nowadays, Microsoft Excel is a widespread name that we all get to hear. Whether you are running a small business or a big corporation, MS Excel holds a prominent place in business operations. The features in MS Excel became more advanced. MS Excel is now seen more like a visual dashboard. It stores data and helps you in maintaining them through its various functions.
For instance, organisations always want to make sure that they move ahead with the technology. That is why instead of just using the ‘Autosum” feature like the early days, they rely on MS Excel for various other things. These include- preparing presentations, constructing graphs and pie charts. Thus, using such features to represent information and data sets is more efficient than writing down the figures on a document.
Microsoft Excel: Features and Benefits
Microsoft Excel is the most used spreadsheet and data management tool worldwide. It provides immense flexibility and compatibility across several operating systems and devices. You can use MS Excel on your PC, MacBook, iPad, iPhone, Android or even tablets. Also, apart from all these flexibilities and user-friendliness, MS Excel has tons of features and benefits.

If you are keen to know more and more about Excel and its uses, you could enrol in our Microsoft Office: Excel Beginner to Advanced course. The courses give you more confidence and a great technical skill for your professional CV or resume; employers value basic and advanced excel skills.
However, let us look at some essential features and benefits of MS Excel now.
1. Data Storage

This is probably the most common usage of MS Excel. This feature enables you to store any type of data for your personal or professional use. It is pretty handy to keep all kinds of data in Excel. You can easily share it with others and give access to them through the cloud. You can store any data type on MS Excel, such as numbers from financial statements, accounting records, graphs, etc.
2. Performing Calculations
This Excel feature has reduced manual workload to a more significant proportion. People now can spend less time using calculations or manual formulas. Its ability to perform both complex and straightforward calculations makes it one of the top and most widely used software worldwide.

There is a whole list of functions to perform all types of calculations. Although, you even have the flexibility to make your list of formulas by either mixing two or three Excel functions or just create a new customised formula.
3. Formulas

Microsoft Excel has an extensive range of formulas instilled in it. Although we will discuss the complex formulas under the advanced Excel skills, let’s look at three of the most used basic Excel formulas in our daily work lives.
Compound Interest
MS Excel allows you to calculate this complex feature. So, compound interest is usually the interest earned on the principal amount and the accumulated interest on any loans or borrowings. “Compound Interest Calculator” on MS Excel allows you to calculate the final amount in different intervals.
Use of (=)
You can type an equal sign on any cell to use the Excel formulas. Then, press the Tab key to allow you to continue inserting other options. For example, you can use formulas such as SUM, SUBTRACT, MULTIPLY, DIVIDE etc.
AutoSum
It is the only formula that has remained consistent over the years. As explained earlier, this formula was also widely used in the early years of MS Excel invention. It allows you to get a total sum of a row of cells. So, if you navigate through the Home tab, you will see it in the far-right corner. In addition, you can click the caret to see other hidden formulas.
4. Data Analysis

MS Excel allows you to store all types of data sets and numbers. Thus, based on your stored data. You could perform several tasks. For example, if you are an analyst, MS Excel would help you analyse these data in several ways. On the other hand, if you are an accountant, you could analyse the financial data stored on Excel to carry out many tasks such as BAS preparation, cash flow analysis, balance sheet analysis, etc.
5. Data Visualisation

Data visualisation refers to pivot tables, graphs, pie charts or histograms to portray the data sets. MS Excel has a wide range of data visualisation tools. It helps make all the data sets look very clean, organised, and helpful if you run a presentation. You can also use different colours and styles to make the data look more pleasant to the eyes.
6. Rearranging Data
If you are handling numerous data sets in your profession, Excel will come in handy for you. You can clean and rearrange all your data by either accumulating all the similar ones under one heading or even arrange everything in the form of graphs or charts.

For example, you can create a drop-down menu of all the client’s names who have subscribed to your email notifications. This option helps to keep all the data neatly organised. Thus, you would not have to go through every cell to look for a specific data type.
7. Conditional Formatting
Conditional formatting can also be referred to as one of the advanced Excel skills. It helps you explore and analyse data, identify patterns and trends, and detect any issues. For example, it highlights essential cells or ranges of cells, emphasises exceptional values, and visualises data using data bars. Furthermore, it also colours scales and icon sets that show any variations in the data.
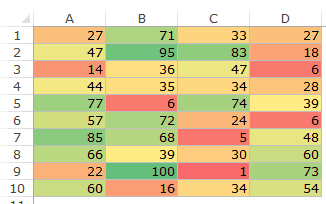
Moreover, this feature changed your cells in the Excel spreadsheet following the conditions that you specify. If the conditions are actual, the cell range is formatted. On the other hand, if the conditions are false, the cell range is not formatted.
8. Sharing and Printing Data

Microsoft Excel gives you the option to print with a lot of customisation. For example, you cloud the margin, page orientation, colour contrast, etc. You can also select a background for the print. Thus, all the data stored in Excel are straightforward to print. Moreover, you could share your Excel file easily if you are using it through a cloud-based system, such as google sheets.
9. Coding

VBA (Visual Basic for Applications) is Microsoft’s language for coding. It allows you to write code for almost all the types of activities you perform manually in Excel. You can automate all kinds of activities. It can range from very simple to highly bold ones. For example, you can use simple coding like “red colour for pending bills” or “inserting a histogram”.
10. Use of Templates and Styles
In Microsoft Excel, there is a range of options where you can use several attractive looking templates for your data sets. For example, you could add different colours or writing styles to specific cells or rows of cells. All of these makes the data look visually appealing ad less monochrome.
Advanced Excel Skills
We have now had a clear idea of the basic concepts of Microsoft Excel, a few of its features and some common uses. Therefore, now let us dig deeper into more complex things. We will now discuss advanced Excel skills. These skills will not only make you job-ready but will also help you in mastering Excel completely!
Advanced Formulas
Excel has many formulas. Thus, here’s a list of the ten most important Excel formulas that comprise a considerable portion of advanced Excel skills. These formulas would take your advanced Excel skills to a whole new level.
1. VLOOKUP
It is one of the most used Excel advanced formulas. Because of the simplicity of this formula and its nature to look up a specific value from other tables, that has one standard variable across these tables.
For instance, you have two tables with details about a company’s employee long term leave records. Column A consists of Employee ID. On the other hand, Column B consists of their names.
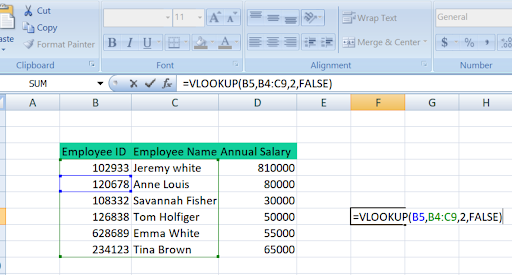
So, in this case, if you want to extract the money accumulated from Column B to Column A, you can do so using VLOOKUP. This function comprises four elements. They are- “lookup_value,” “table_array,” “col_index_num,” and “range_lookup.” An example of the formula is
= VLOOKUP(B5,B4:C9,2,FALSE)
The best part is after using the formula for one cell, if you drag it down, it gets applied to the other cells.
However, VLOOKUP is the most used one by all people out of all the advanced Excel skills. This is because its functionalities are very straightforward and help us find information among the vast data in our spreadsheets.
2. MATCH
There is just one primary purpose for this MATCH function in Excel. It is to look for the position of a data range or a particular item. This function can perform both exact and approximate matches, as well as partial matches. However, it only supports a one-dimensional range, either vertical or horizontal.
Moreover, you could use the MATCH function even to locate two-dimensional ranges sometimes. You can do this by giving MATCH the single row that contains the VLOOKUP value.
Regularly, the MATCH function is joined with the INDEX function to recover a worth at a certain (coordinated) position. MATCH sorts out the position, and INDEX return the worth at that position. For a point by point clarification, perceive How to utilise INDEX and MATCH. The formula for the MATCH function is: “=MATCH(lookup_value, lookup_array, [match_type])”.
3. INDEX
This function is classified under the reference and lookup function on MS Excel. We can say that it acts similar to the VLOOKUP, as discussed earlier. It would return the value in a particular position for a range of data. It works hand in hand with the MATCH function.
Additionally, you can use these particular advanced excel skills for data analysis too. For example, you could use this function alongside other functions to look up and return a specific column’s sum to perform an investigation.
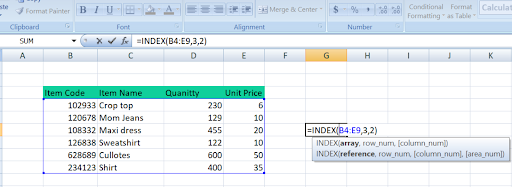
For example, you have a table of different types of clothing names in your Excel spreadsheet. Then, you want to get a formula for one of the outfits, for example, “Maxi dress”. Therefore, in that case, all you need to do is put is – “=INDEX (B4:B9,3,2)”. In this case, B4: E9 represents the cells in the table and the number 3 is the positioning of “dress” in that table.
4. SUMIF and COUNTIF
In specific investigations, you may have to channel a few perceptions while applying the total or check work. In such cases, this high-level dominant SUMIF work in dominate is at our salvage. It channels every one of the perceptions dependent on specific conditions given in this advanced Excel formula and summarises them.
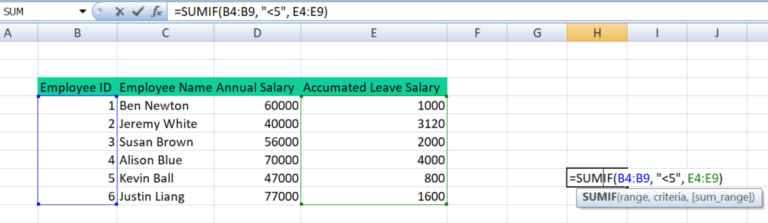
For example, you want to know the sum of the accumulated leave balance from only the employees whose employee ID is less than 5. In this case, all you have to do is just type in the SUMIF formula “=SUMIF(B4:B9,”<5″,E4:E9)”.
On the other hand, COUNTIF function is used to count cells based on a single condition and a single range. COUNTIF is used to count cells based on multiple conditions in different ranges. The Syntax for this function is “=COUNTIF(range, criteria)”. Thus, it counts all the cells in a spreadsheet that meets the criteria described.
Therefore, these two advanced excel skills allow you to sum and count customised rows or cells that you require. As a result, it saves a lot of time and effort from an individual employee.
5. OFFSET
Out of all the Excel advanced skills, this particular one dominates work with a mix of different other functions like SUM or AVERAGE. It could give a decisive touch to the estimations. It is best utilised when we are embedding lots of rows and columns into a current Excel spreadsheet. Offset Excel provides us with a reach to specify reference cells, several rows, and different columns.
For example, if we want to count the average salary of the first seven employees in the company, we could use this OFFSET function. The general formula is “=OFFSET(reference, rows, cols, [height], [width])”. Thus, this option saves time in calculating the average for particular data sets.
6. XNPV and XIRR
XNPV function in MS Excel uses specific dates that correlate to individual cash flows being discounted in the series. It is more precise compared to the NPV function.
The Syntax formula for this function is:
=XNPV (Rate, Cash flows, Dates of Cash Flow)
Moreover, this function is convenient for financial analysts since a large part of their role includes cash flow analysis.
On the other hand, the XIRR function is more like a financial function. It returns the internal rate of return (IRR) for a cash flow series at irregular intervals. Thus, its primary purpose is to calculator the IRR for irregular cash flows in the Excel spreadsheet.
The Syntax formula for this function is:
=XIRR (values, dates, [guess])
Thus, both XNPV and XIRR are two of the most advanced Excel skills that assist a professional in analysing cash flows through its different sets of formulas and benefits.
7. PMT
The PMT function is helpful to calculate future payments if you have a loan. This is because the values for the interest rates, principal amount and the loan term will already be present in the spreadsheet. Therefore, you would calculate the future payments in terms of both principal and interest by using all the values.
The Syntax formula is:
= PMT (rate, per, PV, [fv], [type])
For example, your principal amount is £20000 (Cell: A3), the interest rate is 0.45% (Cell: B3) for a time period of 36 months (Cell: C3), you would calculate your PMT as =PMT (B3/12, A3, C3).
8. IF AND
This function proves helpful when you need to make certain conditions to go over a stack of data. The IF function helps utilise the high-level Excel IF work to make another field dependent on these conditions on a generally existing track.
For instance, if you want to mark the employees with salaries above 70K and employee ID greater than 5, then the formula will be:
IF(AND(F4>5,G4>70000)1,0)
*F4 & G4 are just indications of the cell numbers.
9. CHOOSE
The CHOOSE function provides an excellent formula for analysing different scenarios in financial modelling. It gives the option to pick between a specific number and return the “choice” selected. For instance, if you have three distinct values for expenses from non-current liabilities from next year based on assumptions, you can return the sum as per your necessity using the CHOOSE function.
The Syntax formula is:
CHOOSE(index_num, value1, [value2], …)
For instance, =CHOOSE(3,”apple”,”orange”,”peach”) returns “peach”, since peach is the 3rd value listed after the index number.
10. QUARTILE
The QUARTILE function returns the quartile (every one of four equivalent gatherings) in a given arrangement of information and can return least worth, first quartile, second quartile most extreme worth. This function brings the quartile measure of the fields in a cluster. The capacity returns a mathematical worth as indicated by the mentioned percentile.
The Syntax formula is:
=QUARTILE (array, quart).
Pivot tables
One of the most time-consuming and intensive advanced excel skills are Pivot Tables. You can use them for several purposes. These include- counting, sorting data and displaying them in a more synchronised manner in tables. You can cut and insert data inside these tables quite easily as well.
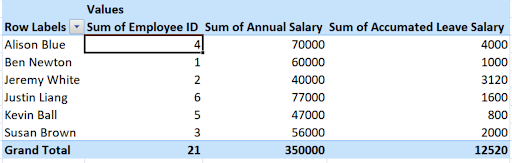
Additionally, it is effortless to insert a pivot table in your Excel spreadsheet. If you go to the “Tables” section on top, there is an option that says pivot table. Also, you can drag and drop any column of cells into the table and customise the drop-down menu and all headings. The data sets are arranged in sequential order, just as you want them to be.
A Pivot Table will naturally put all the matching data in one group, giving you summaries from a big table. For instance, if you had a table loaded with all “expenses” and each row was an item and a sum, in just a few clicks, you could show all the data provided are summed and are put together in a group of expenses. Thus, these tables help you a lot in analysing data sets.
Filters
The filter function on MS Excel helps you sort out unnecessary data and hide them from the spreadsheet. This function filters out all information from the most superficial criteria example, filtering out the cost of machinery to particular criteria, such as just showing the types of machinery that cost less than 2% of the total sum of the machinery! You could also trace buyers or suppliers by filtering out their location. Pretty amazing, right?
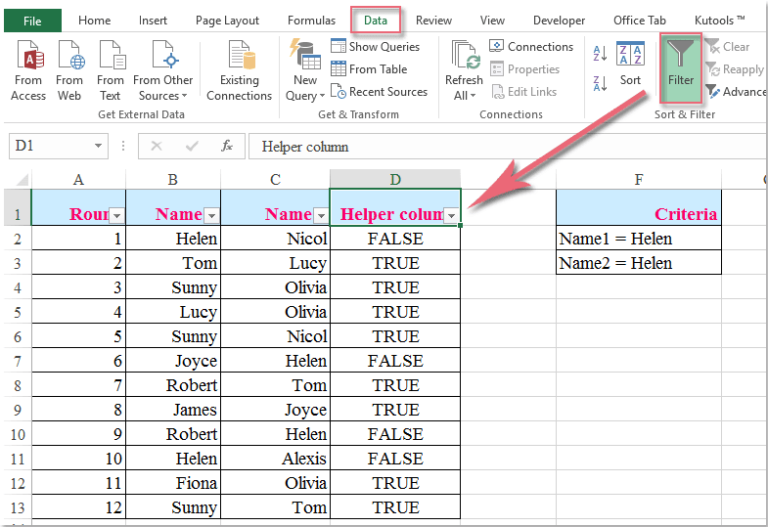
You can get this filter option at the “Data tab”. It is named “filter and sort”. Thus, when you select the option after clicking the drop-down menu, you could use several ways to filter out information. It becomes more essential to use this option when filtering out more than one criterion in a single row. For instance, to find specific machinery, filtering out both the price and purchase date.
Moreover, the filtering option becomes very handy when you know what you are looking for in the large data pool. Also, if you have a retail business and customers call about a specific product type, you can find it in seconds using this function. It saves time and gives you an exact answer.
Charts
MS Excel has more than 10-20 types of different charts present. These include- bar charts, pie charts, column charts, doughnut charts, bubble charts, radar charts, combo charts, etc. If you have a single line of information, such as “types of cars’’, you could easily use a pie chart or a bar chart to represent that.
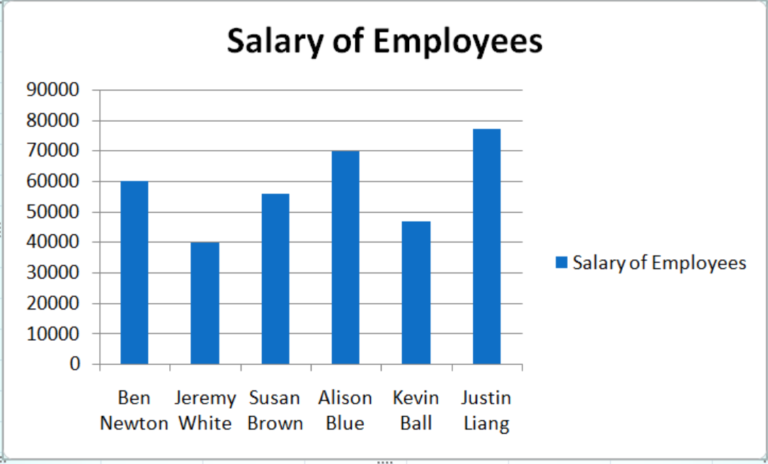
However, for multi-line data such as “Employee names and their Salaries”, you have to use scatter charts, column charts or combo charts. Thus, to insert a chart, you just have to click “insert” on the top right-hand side and select “charts”. The advantage of using charts is that you get to organise all our data and create a visualisation.
Furthermore, it will become easier for you to analyse the pattern and number by looking at the charts. Tables and writings give you information, but charts create a 3D image or visual representation of all the information.
This tool comes in handy when analysing an extensive set of data and trying to understand the pattern. For example, if you want to know the number of dresses being manufactured at your store compared to the number of skirts, you could easily do that by seeing the pattern on any of the charts.
Slicers
This function is the last one on our list for advanced Excel skills. You can find this function in the “Insert section”. Then, you just have to select the filter option and click on slicers. They almost have the same function as filters. The Pivot table slicers show you only the data you want to view and hides others. The only difference is that instead of filtering out data using a drop-down menu, they offer an option for you to see what you want to see and the things that you don’t want to see as well.
The slicers allow all the options to come up in small boxes, and you can click and unclick the category or product as per your preference. The advantage of this is that you will be known which items are missing from the pivot table instead of just seeing what you asked for.
For example, if you have four columns in your pivot table with the headings – “Customer name, Customer address, Customer phone number and Name of salesperson”. In this case, if you only want to see 3 of the customer names out of 10, you could do so using the slicers, but at the same, you could also see what is missing on the table through the small boxes created by the slicers. Thus, it helps you to keep track of everything as well as filter out unwanted data.
Closing Note
Our world is getting more and more dependent on technology. The increased demand for MS Excel over the years is living proof. Moreover, Excel has a pool of features and functions that make it easier to maintain data and analyse them. Thus, the whole purpose of this article is to make you familiar with MS Excel- its features and the advanced Excel skills required. Also, if you want a deeper understanding, our Microsoft Office: Excel Beginner to Advanced course would be an excellent option for you.
Read more blogs
- Can You Really Make Money With PLR Courses? A Realistic Breakdown
- PLR Course Licensing Explained: What “Whitelabel” Really Means
- The Fastest Way to Launch a Professional LMS Without a Tech Team
- Where to Buy PLR Courses You Can Legally Resell
- How UK eLearning Businesses Are Scaling Faster With Ready-Made Courses
- How to Become an EYFS Teaching Assistant in the UK: Steps, Qualifications & Career Tips
- 10 Everyday Phrases to Get Started with British Sign Language (BSL)
- Top Benefits of Learning British Sign Language in the UK
- Complete Guide to Learning British Sign Language (BSL) Online
- From Console to Career: GAMIVO and Janets Partner to Shape the Future of the Gaming Industry
- Janets Partners with Humble Bundle to Support Hello World Charity and Empower Change
- What is Probate? An Essential Guide to Wills and Probate Law
- How to Write Your Personal Statement in 10 Steps
- How to become a Phlebotomist? Everything you need to know
- What is the minimum wage in the UK? Everything you need to know
Get a FREE Course